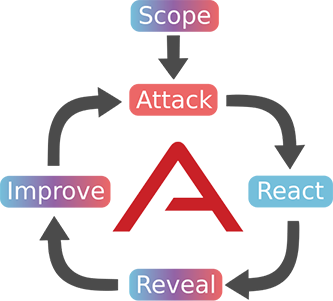
This is the second post in the Purple Teaming Chronicles series (the second is here). In this post, we will be focusing on the “attack” stage of a purple teaming exercise as well as the “react” stage — and explore how security teams can use MITRE ATT&CK and the AttackIQ platform to augment red team operations and optimize their limited resources (in time, personnel, and technology). An automated breach and attack simulation platform like AttackIQ’s can help security teams test and validate their security controls safely, at scale, in production. One net benefit of an automated platform: Because an automated platform can test hundreds of assets quickly, it allows red and blue team members to focus scarce their analytic time on other things, like making security fixes, threat research, or niche penetrations.
Let’s dive in to how an automated platform can enable purple team operations and deliver business value to a company.
Attack Stage: Executing the Attack at Scale
In the previous post on the series we covered the TTP research part of the attack stage, in which we developed a custom tool that increased the reliability and efficacy of existing tooling. The next step is to use that tool to test the effectiveness of the prevention and detection capabilities that the blue team has in place in the assets that were defined in the scope stage.
If the amount of assets is big enough, this task can be time and resource consuming, and also boring due to its repetitive nature (imagine having to execute the attack in 500 assets and reviewing the execution results in each). It helps to automate a task that requires such scale and repetition. Here is where breach and attack simulation (BAS) platforms come into play; they can execute a given threat on multiple assets at once and then visualize the attacks.
Not all BAS platforms offer the possibility of writing custom attacks, however, and that is something an advanced red team will need.In the following sections, we will show how the AttackIQ platform can be leveraged by a red team to automate the execution of attacks on multiple assets and quickly review the execution results using a custom written attack based on the tool presented in the previous post.
From the Tool to the Scenario
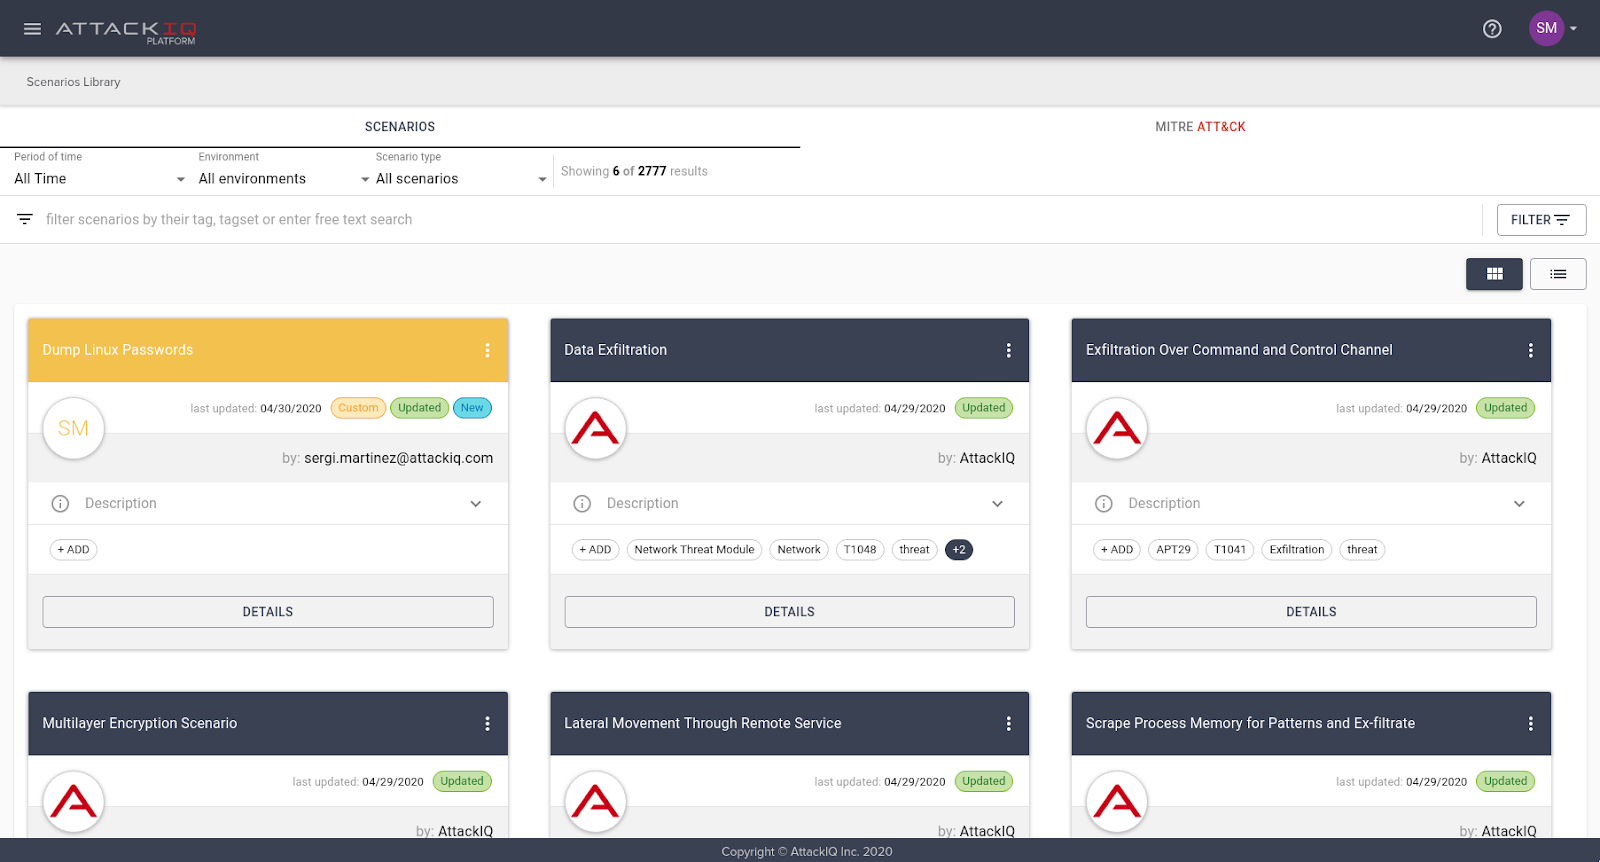
In the AttackIQ platform, a threat or attack that can be executed on the assets is called a scenario.
The platform offers a wide variety of pre-built scenarios that cover many of the TTPs specified in the MITRE ATT&CK matrix.
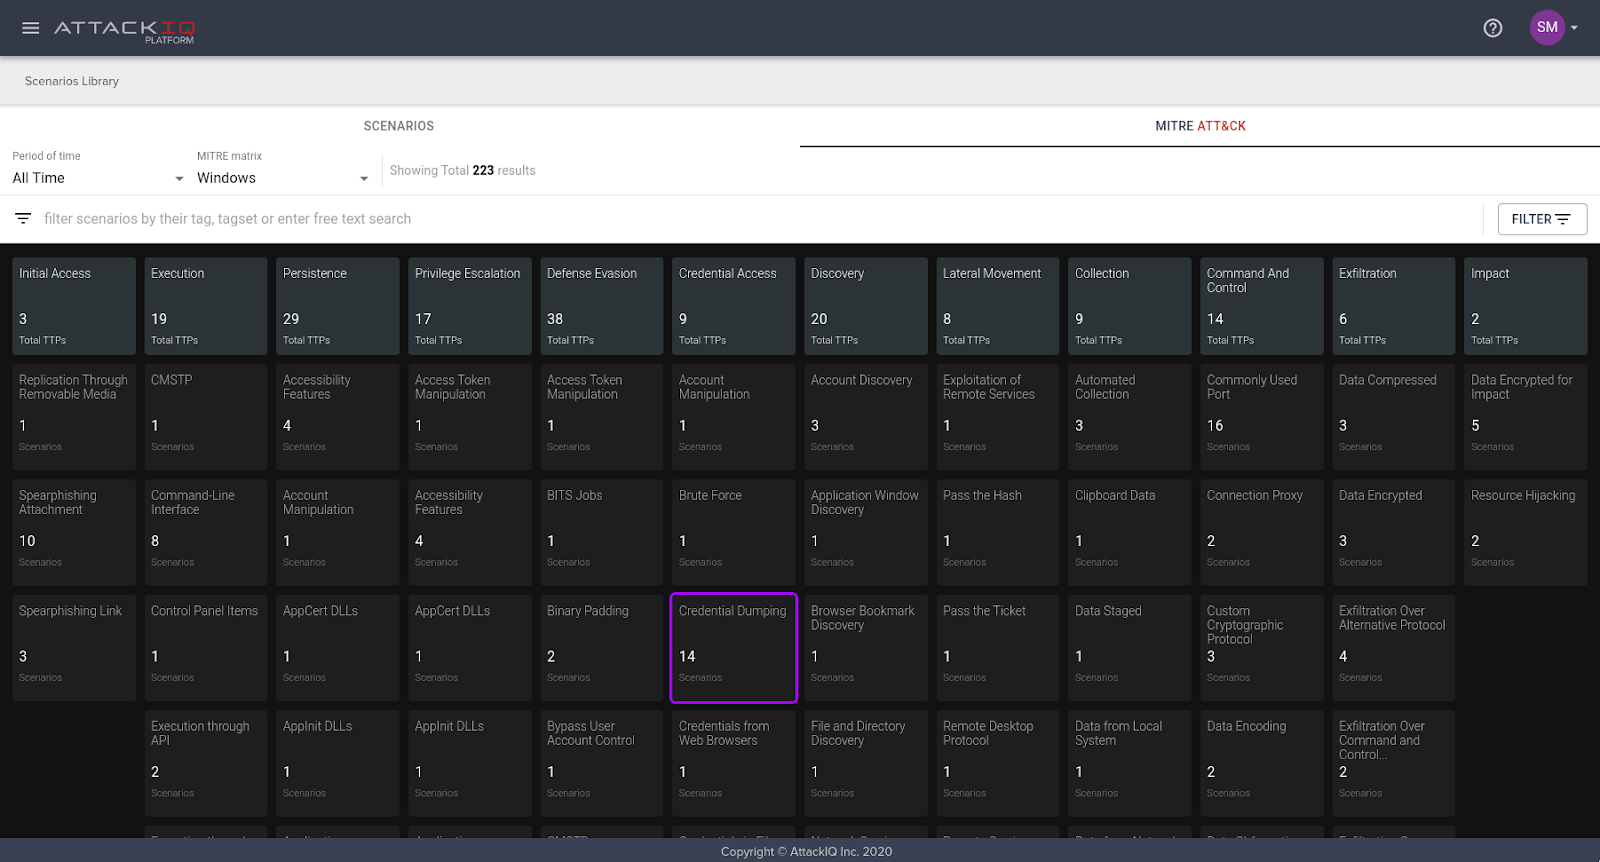
AttackIQ deploys pre-built scenarios developed in-house by our team, but our open API allows customers to write their own custom scenarios to suit their specific needs. The scenarios are written in Python so users already have content publicly available to speed up the development process. Customers also have full access to our scenario libraries to help them as they write their own code. Each scenario has its own configuration user interface, which is created dynamically with code. This allows the user to design scenarios to behave differently based on the basis of the configuration values they set.
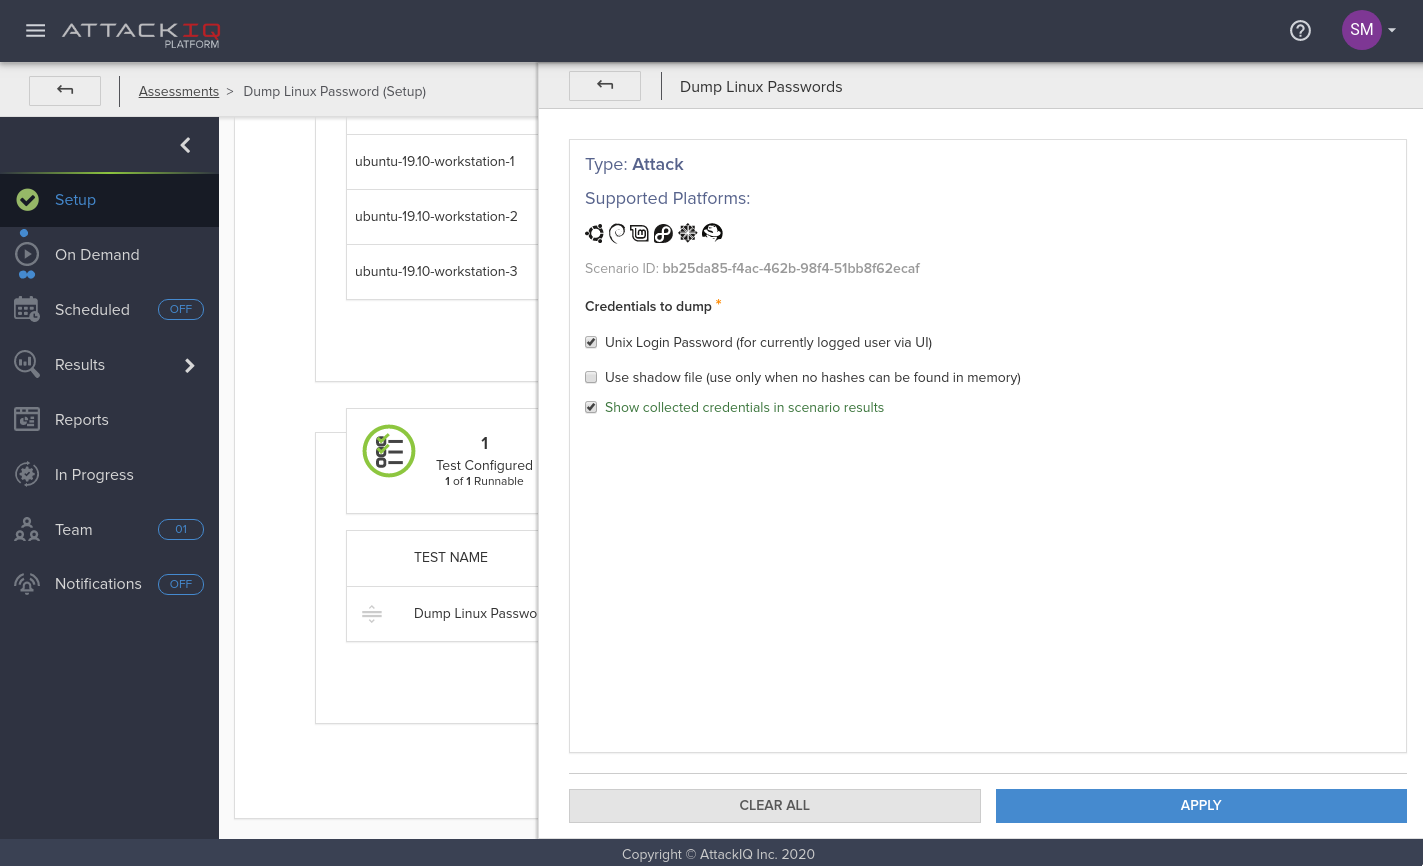
In our red team use case, we developed a simple scenario that uses the tool we built during the research step of the attack stage. This scenario was written keeping in mind that. In the future, we might expand these credential dumping capabilities so we honored the configuration options that the tool has, and added an additional option to select which type of credentials we want to retrieve.
Once the scenario is written, it can be packaged and uploaded to the AttackIQ platform. It will then appear in the scenario library as a custom scenario, ready to be used.
Executing the attack
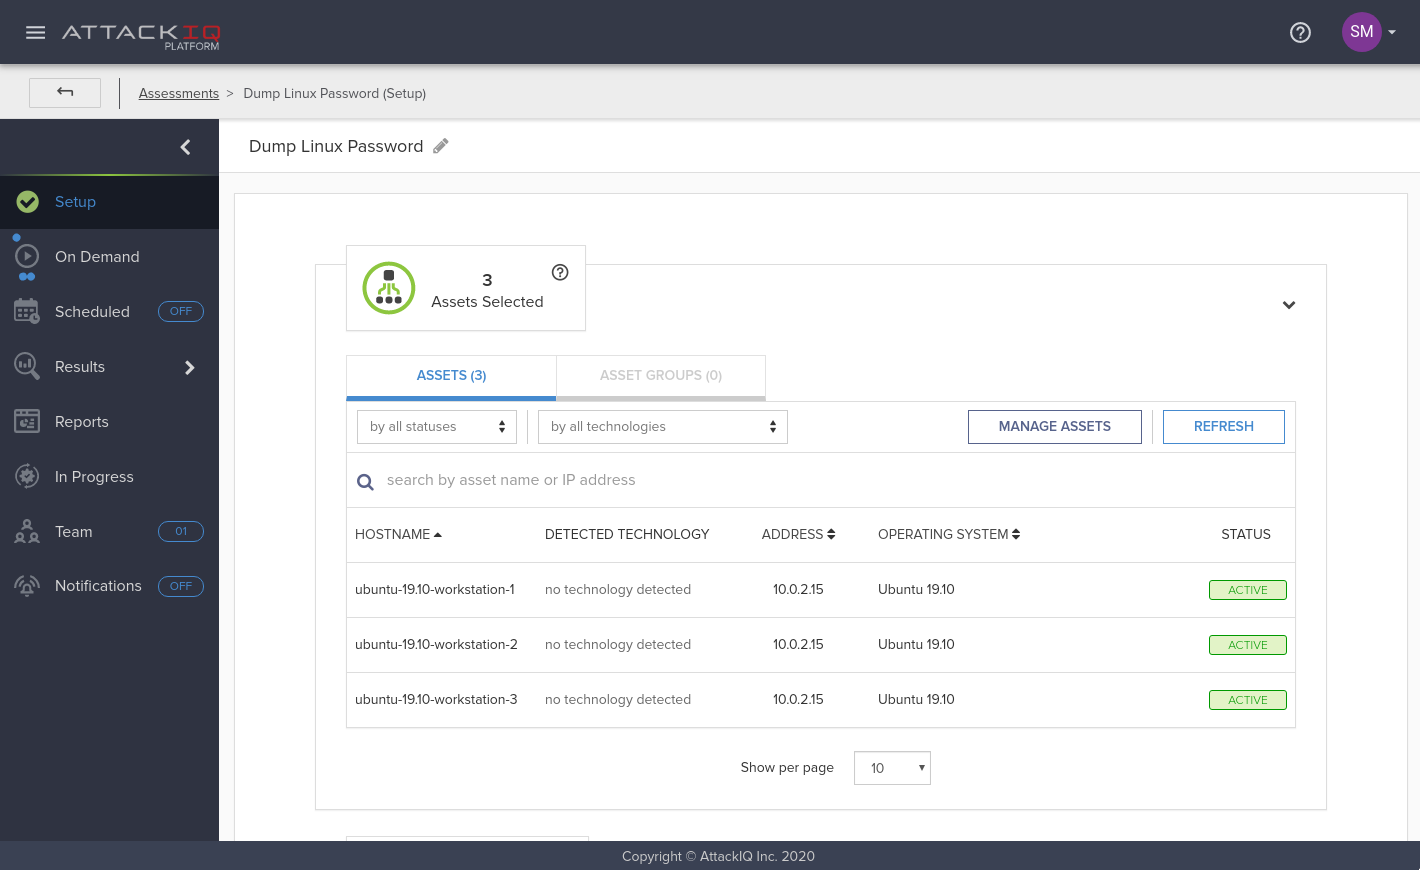
In the AttackIQ platform, to execute scenarios we have built what we called assessments. An assessment contains a set of assets — the systems where you will execute the attacks — and a collection of tests, and an organizational structure (like a bucket) which can be used to identify stages of an attack. At the same time, each test is a collection of scenarios. The assessments can be created from scratch or can be selected from a list of built-in plans.
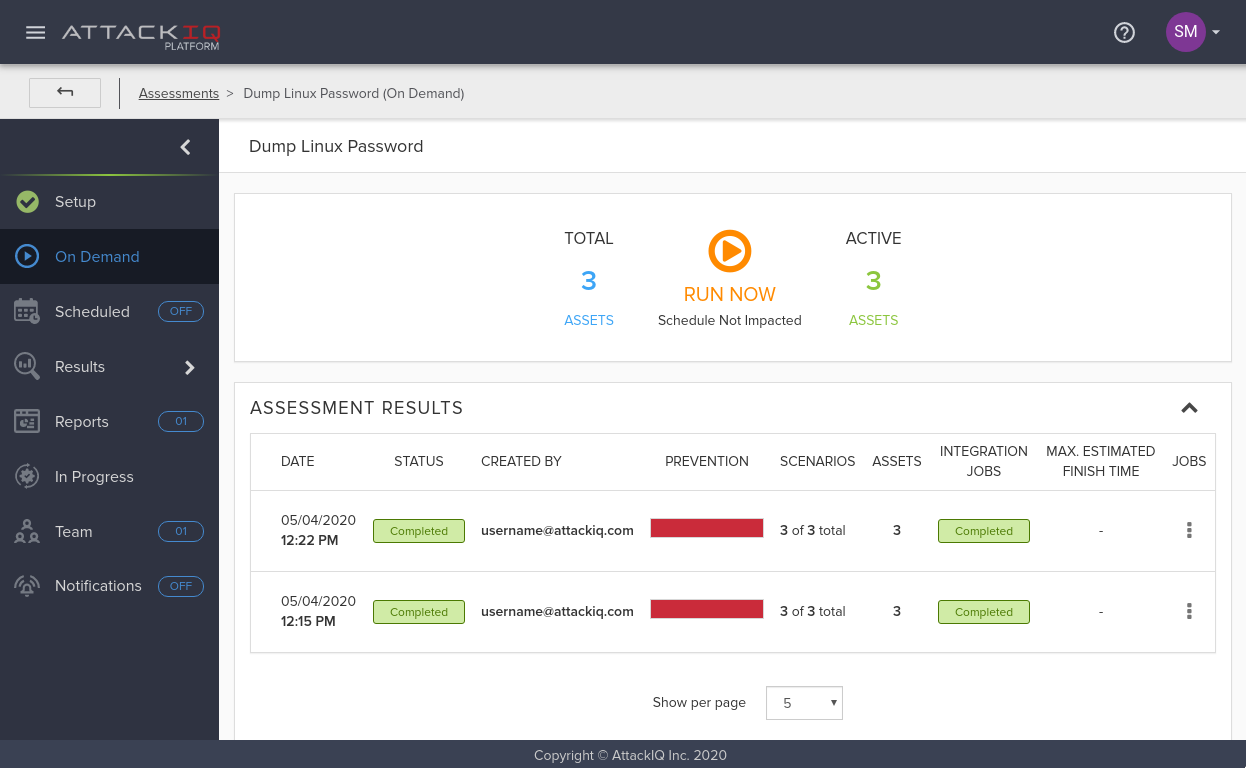
Once the assessment is created and populated, unless otherwise specified the user hits the “Run Now” button and the platform contacts all the selected assets to deliver their corresponding jobs. Each asset will run each of the configured scenarios, preserving the order they had when they were added into a test.
We created and configured a custom assessment for running the newly created scenario on three different assets. Those Assets are running Ubuntu 19.10, simulating being the workstations that a given company might have. Please note that in a real scenario the list of assets would be much larger, and to that end, asset groups could be used.
Checking the results
Once the execution is completed, it’s time to view the results. One of the advantages that BAS platforms usually have is convenient results visualization. Analyzing the results of an assessment that ran a scenario on hundreds or even thousands of assets can be exhausting and unmanageable without some kind of data processing.
The AttackIQ platform provides insights on the results of assessment executions at different levels, with different levels of detail. As an example of aggregated results visualization, the summary results view provides a graph that shows the evolution of detections and preventions for that particular assessment, if it has been run multiple times. (In the screenshot below we can see that there were no detections on the two runs we did.) This view can help check whether the security posture regarding the tested scenarios is evolving positively or negatively.
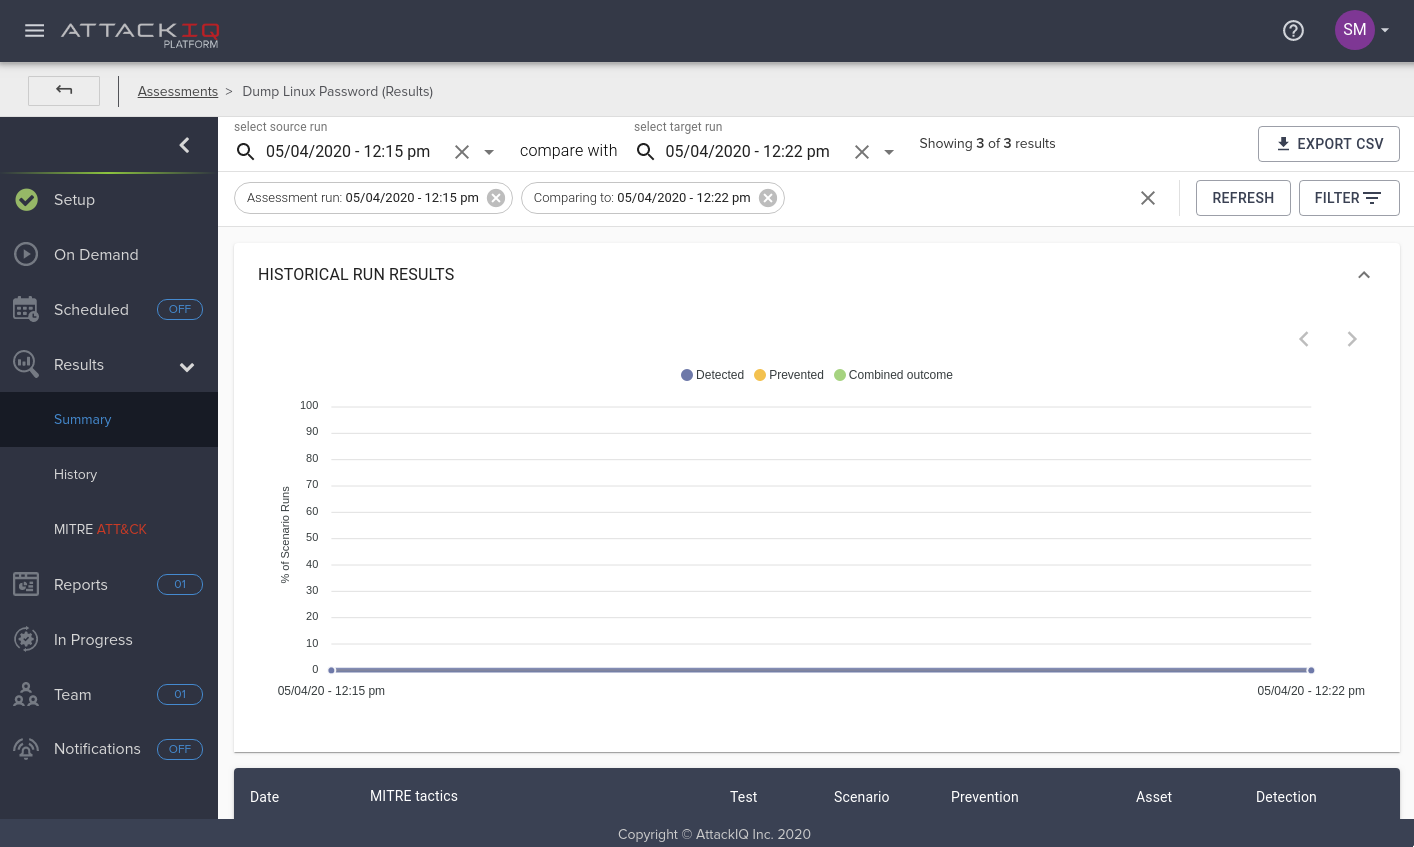
In this case, as can be seen with a simple glance in the previous screenshot, our security controls were not able to prevent or detect the threat. We will address this issue in the following blog posts of this series.
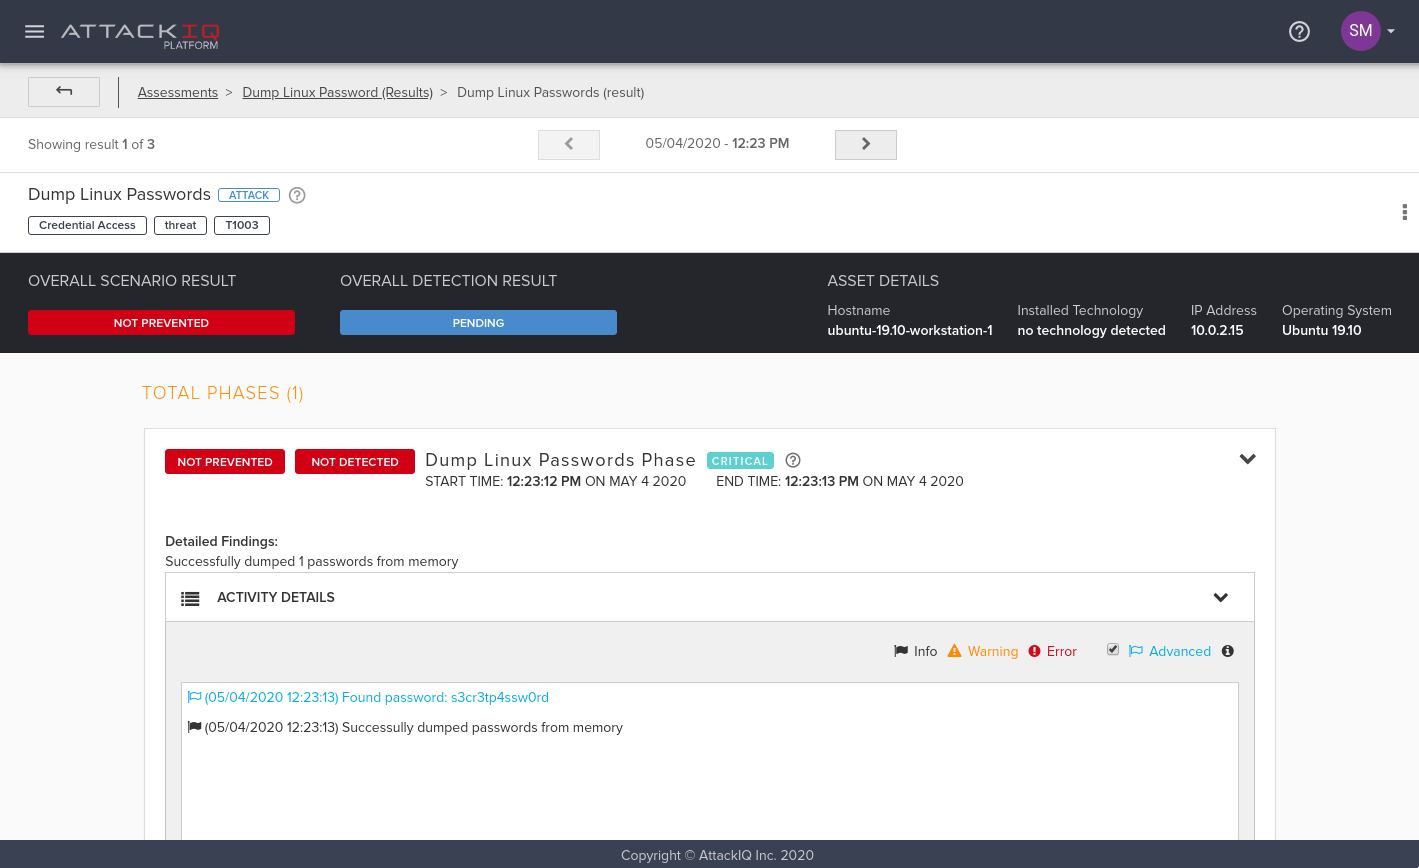
The aggregated results views are useful to quickly collect information. However, sometimes more detailed information is needed. For this purpose, the AttackIQ platform offers a detailed view of scenario executions and provides details about the scenario execution, to include findings, recommended mitigations, Indicators Of Compromise (IOCs) that the scenario generated, detection results, and even relevant debug messages that will help the user understand the attack execution.
In the scenario we described in the first post in this series, in which the attacker dumped the user login password in GNU/Linux, we can even see the password retrieved. As we saw before, showing the retrieved password is an option that we included in the scenario configuration, meaning that if we unchecked that option in the scenario parameters, the password would be redacted.
Following this process, the red team can execute this threat in a reproducible way in as many assets of their corporate network as they choose, being confident that the manner in which the technique is executed will remain constant even when executed on thousands of assets.
With this capability you can engage with the blue team to improve the overall security posture of your company. The blue team can leverage the same process to reproduce the exact same results as the red team and do so without needing to be subject matter experts on the offensive aspect of this assessment. The AttackIQ platform allows them to focus on what they do best.
The React Stage
At this point, after an attacker dumps credentials at scale, there are two options: either the blue team is alerted of suspicious activity in the corporate networks, or they are not.
If they were alerted, we would enter a phase of threat response by following threat hunting methodologies that would allow the measurement of things such as mean-time to detection (MTTD), mean-time to recovery (MTTR), and other techniques. Given the complexity and scope of this discussion, we will focus on the worst case scenario, which is what we saw in the previous results: no prevention or detection was triggered after executing this attack.
In the following blog posts we will dig deeper into the “reveal” and “react” stages.
Conclusion
In this post we explained how the AttackIQ platform can help a red team, as part of the “attack” stage on a Purple Teaming exercise, to easily execute the same technique on multiple assets. We have also seen some of the data visualization capabilities that can help the red and blue teams.
In the next post we will cover the “reveal” and “improve” stages of a Purple Teaming exercise. We will explain how we can implement detection mechanisms for the Credential Dumping technique on hosts running GNU/Linux, how to forward that information to a SIEM (Splunk), and how to configure the SIEM to generate alerts on the desired events. Additionally, we will show how the AttackIQ Platform can be configured to integrate with Splunk to automatically retrieve information about a scenario execution to be able to display the detection results directly in the results visualization views and reports.